 |  | |
| HomePrev | Part XII. Reports | Next |
|---|
Table of Contents
Once you have created a folder, the next step in building a report is to create or clone a template. Templates allow you to run a report more than once without building it anew every time, by changing definitions to suit current requirements. For example, you can create a shared template that reports on circulation at a given library. Then, other libraries can use your template and simply select their own library when they run the report.
It may take several tries to refine a report to give the output that you want. It can be useful to plan out your report on paper before getting started with the reporting tool. Group together related fields and try to identify the key fields that will help you select the correct source.
It may be useful to create complex queries in several steps. For example, first add all fields from the table at the highest source level. Run a report and check to see that you get results that seem reasonable. Then clone the report, add any filters on fields at that level and run another report. Then drill down to the next table and add any required fields. Run another report. Add any filters at that level. Run another report. Continue until you’ve drilled down to all the fields you need and added all the filters. This might seem time consuming and you will end up cloning your initial report several times. However, it will help you to check the correctness of your results, and will help to debug if you run into problems because you will know exactly what changes caused the problem. Also consider adding extra fields in the intermediate steps to help you check your results for correctness.
This example illustrates creating a template for circulation statistics. This is an example of the most basic template that you can create. The steps required to create a template are the same every time, but the tables chosen, how the data is transformed and displayed, and the filters used will vary depending on your needs.
Click on the My Folder template folder where you want the template to be saved.
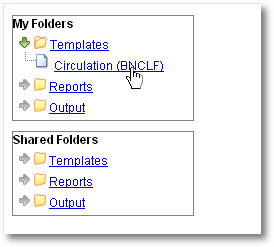
Click on Create a new Template for this folder.

You can now see the template creating interface. The upper half of the screen is the Database Source Browser. The top left hand pane contains the database Sources drop-down list. This is the list of tables available as a starting point for your report. Commonly used sources are Circulation (for circ stats and overdue reports), ILS User (for patron reports), and Item (for reports on a library’s holdings).
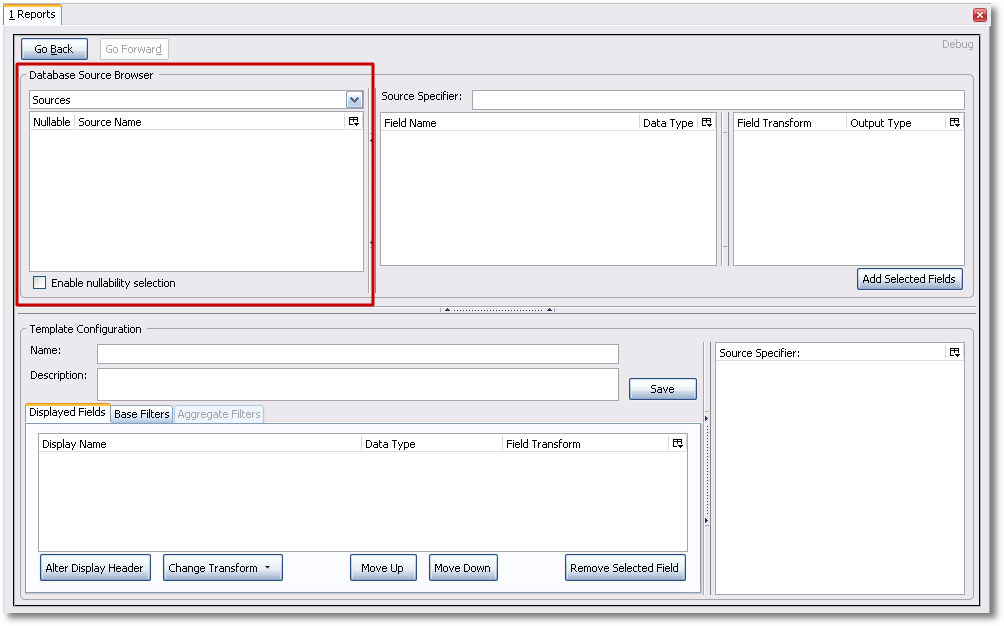
The Enable source nullability checkbox below the sources list is for advanced reporting and should be left unchecked by default.
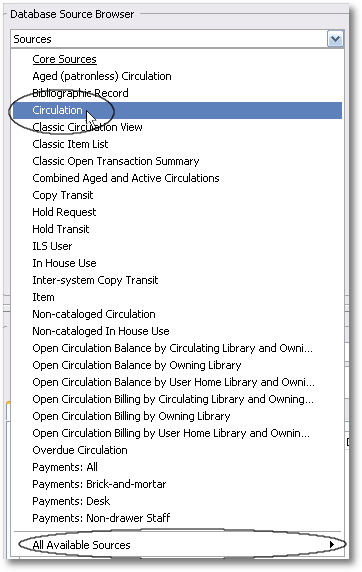
Select Circulation in the Sources dropdown menu. Note that the Core Sources for reporting are listed first, however it is possible to access all available sources at the bottom of this dropdown menu. You may only specify one source per template.
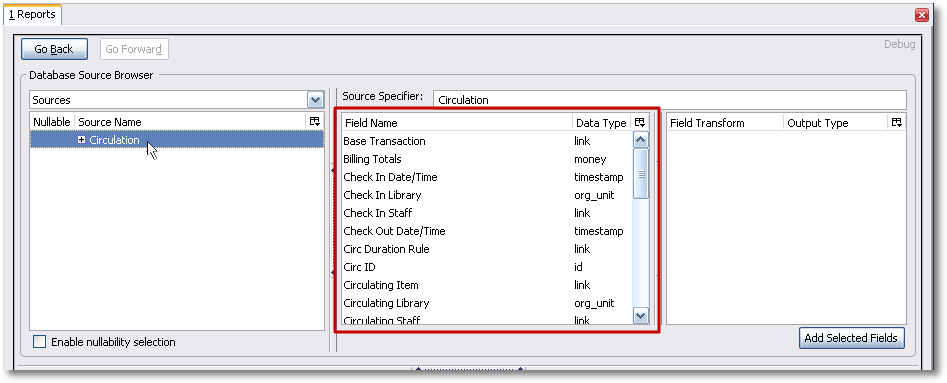
Click on Circulation to retrieve all the field names in the Field Name pane. Note that the Source Specifier (above the middle and right panes) shows the path that you took to get to the specific field.
Select Circ ID in the middle Field Name pane, and Count Distinct from the right Field Transform pane. The Field Transform pane is where you choose how to manipulate the data from the selected fields. You are counting the number of circulations.
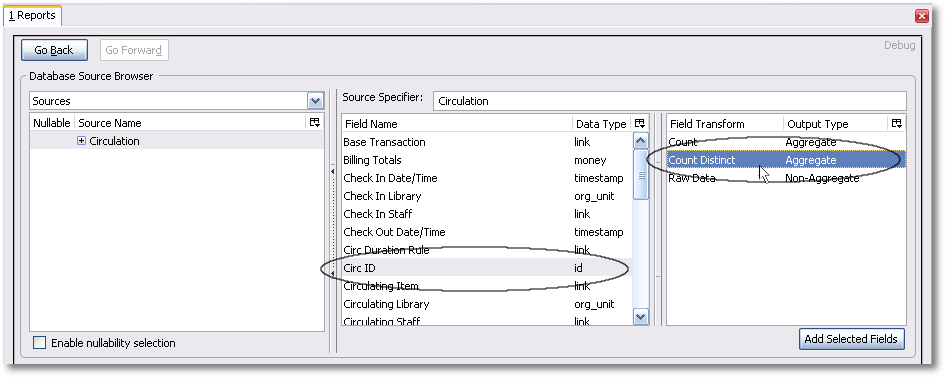
Field Transforms have either an Aggregate or Non-Aggregate output type. See the section called Field Transforms for more about Count, _Count Distinct, and other transform options.
Click Add Selected Fields underneath the Field Transform pane to add this field to your report output. Note that Circ ID now shows up in the bottom left hand pane under the Displayed Fields tab.
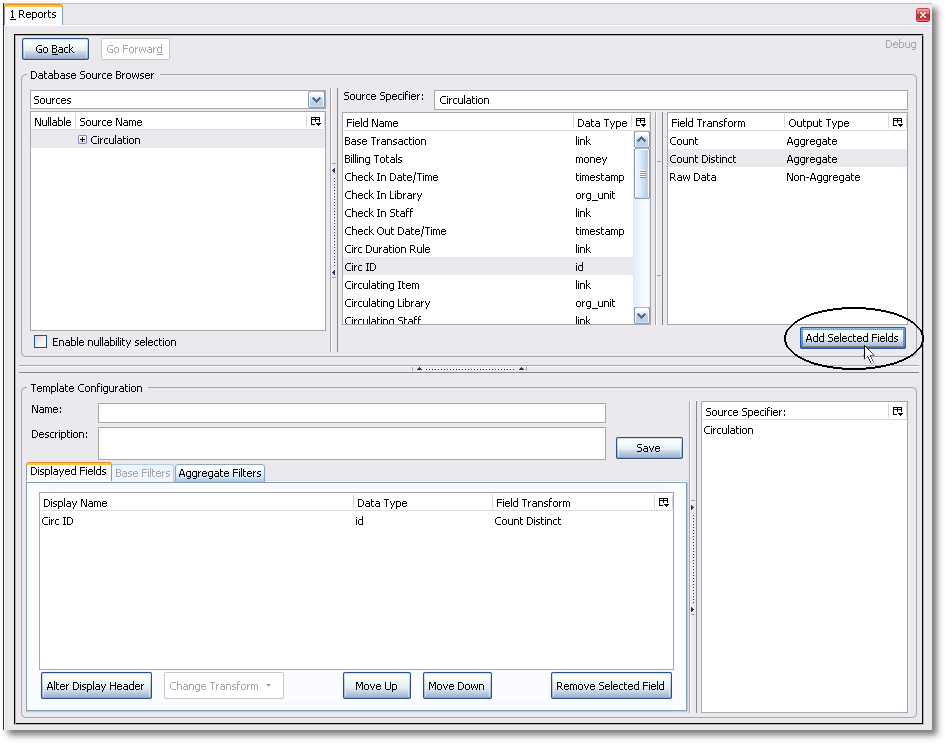
Circ ID will be the column header in the report output. You can rename default display names to something more meaningful. To do so in this example, select the Circ ID row and click Alter Display Header.
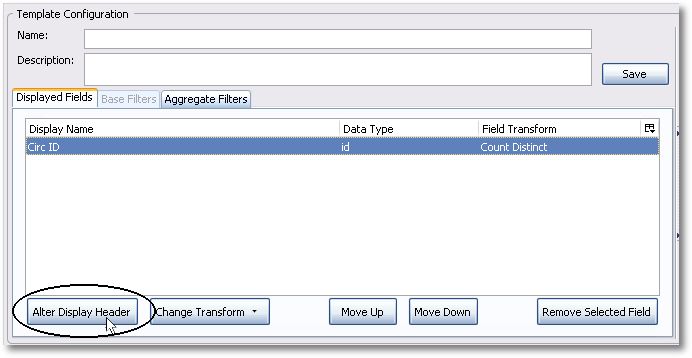
Double-clicking on the displayed field name is a shortcut to altering the display header.
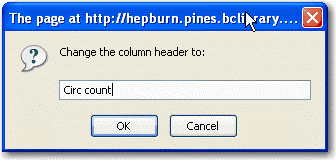
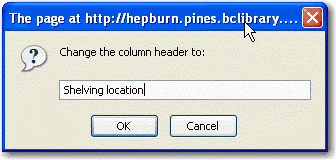
Type in the new column header name, for example Circ count and click OK.
Add other data to your report by going back to the Sources pane and selecting the desired fields. In this example, we are going to add Circulating Item -→ Shelving Location to further refine the circulation report.
In the top left hand Sources pane, expand Circulation. Depending on your computer you will either click on the + sign or on an arrow to expand the tree.
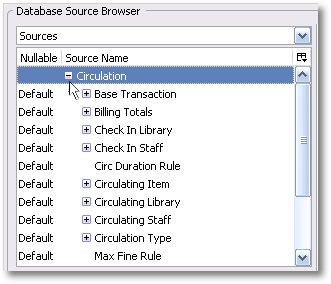
Click on the + or arrow to expand Circulating Item. Select Shelving Location.
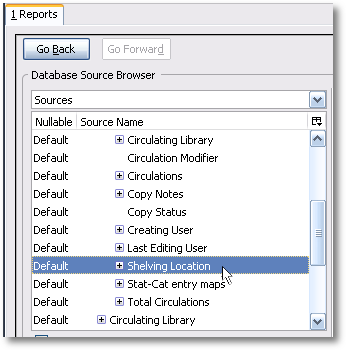
When you are creating a template take the shortest path to the field you need in the left hand Sources pane. Sometimes it is possible to find the same field name further in the file structure, but the shortest path is the most efficient.
In the Field Name pane select Name.

In the upper right Field Transform pane, select Raw Data and click Add Selected Fields. Use Raw Data when you do not wish to transform field data in any manner.
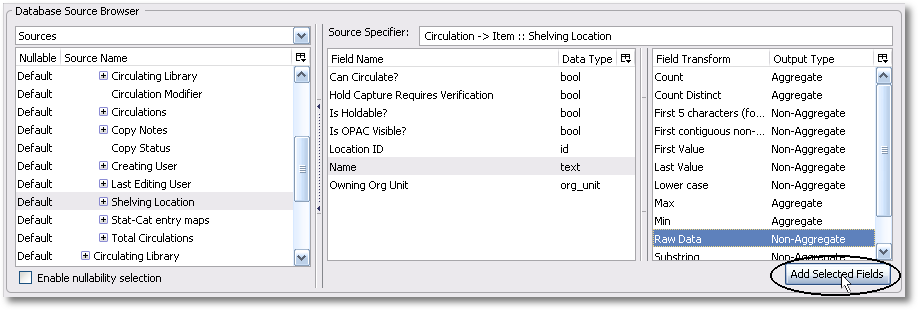
Name will appear in the bottom left pane. Select the Name row and click Alter Display Header.
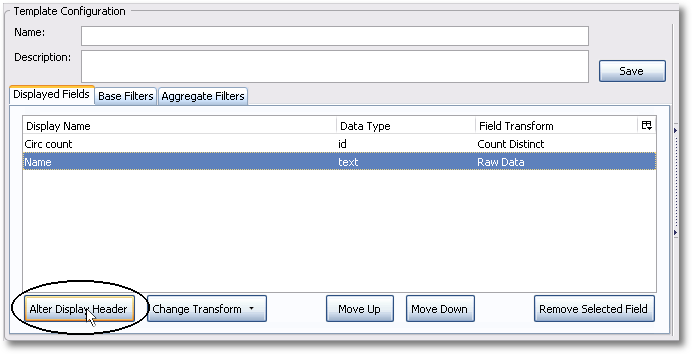
Enter a new, more descriptive column header, for example, Shelving location. Click OK.
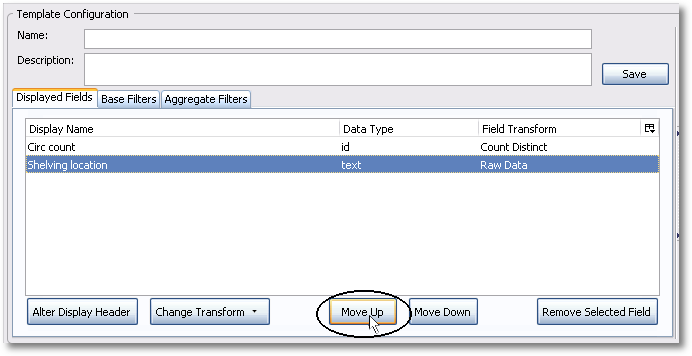
Note that the order of rows (top to bottom) will correspond to the order of columns (left to right) on the final report. Select Shelving location and click on Move Up to move Shelving location before Circ count.
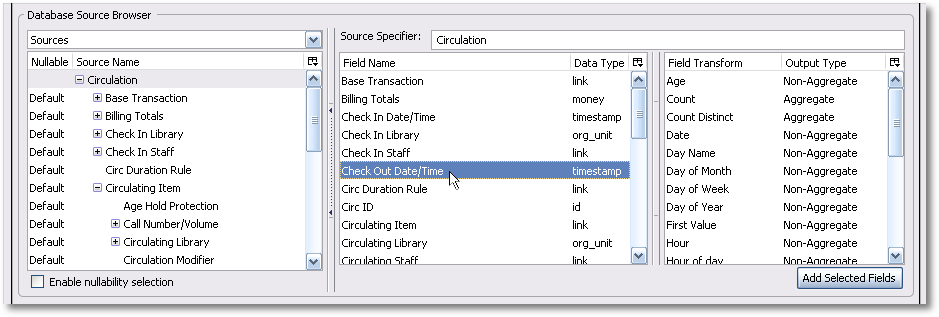
Return to the Sources pane to add more fields to your template. Under Sources click Circulation, then select Check Out Date/Time from the middle Field Name pane.
Select Year + Month in the right hand Field Transform pane and click Add Selected Fields
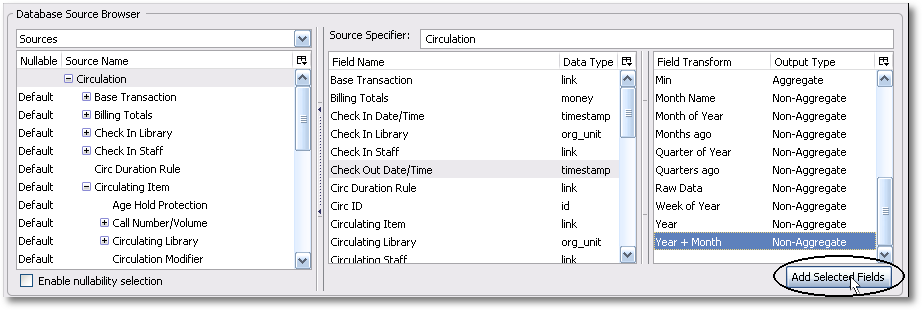
Check Out Date/Time will appear in the Displayed Fields pane. In the report it will appear as a year and month (YYYY-MM) corresponding to the selected transform.
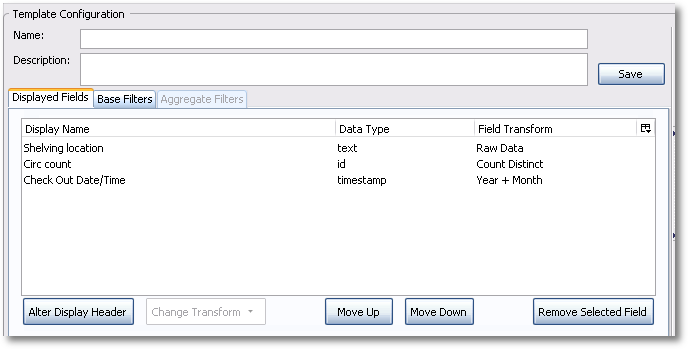
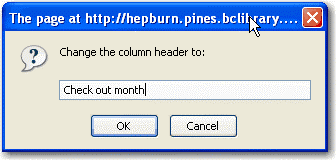
Select the Check Out Date/Time row. Click Alter Display Header and change the column header to Check out month.
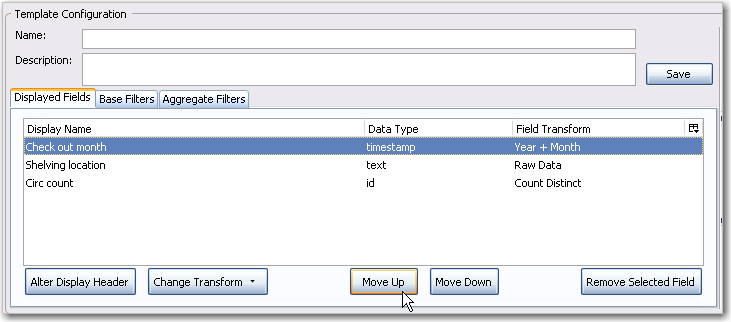
Note the Change Transform button in the bottom left hand pane. It has the same function as the upper right Field Transform pane for fields that have already been added.
